Case study · Predictive ML
Detecting Content Decline for Prioritized Refresh
Executive summary
A ranking tool for a constrained editorial decision
Find pages already showing meaningful impression decline when only a fraction can be reviewed.
Train a Random Forest on 144,575 content items and test it on entirely unseen clients.
ROC AUC 0.767 and 100% precision among the top 50 items in the held-out evaluation.
This detects and prioritizes observed decline; it does not forecast future traffic or prove that a refresh will cause recovery.
1. Problem & Decision
Content decay is a slow, invisible problem. A page that once ranked on page one gradually loses impressions as content ages, competitors publish fresher alternatives, and search algorithms shift. By the time an editorial team notices the traffic drop, recovery is expensive and uncertain.
The core decision this work supports: which pages should we refresh first? When an editorial team has 200 pages but capacity to refresh 20, the cost of a wrong call is real — wasted effort on pages that didn't need it, or missed recovery on pages that did.
This project treats the task as retrospective detection and triage: classify whether a page is already declining in search impressions, then rank the highest-confidence cases for editorial review. It is not a future-traffic forecast. The source warehouse contains more than 519,000 content items across 104 pseudonymized clients and 17 months of daily performance history; the final modeling cohort is smaller after eligibility filters.
2. Data
Source & Scope
Dataset: FlyRank internship warehouse (hf://datasets/FlyRank/internship-warehouse), build v20260703.
Date window: January 2025 – June 2026 (~17 months).
| Table | Rows | Grain |
|---|---|---|
dim_clients | 104 | One per pseudonymized client |
dim_content | 519,606 | One per content item |
fact_content_daily_performance | 78,835,655 | Date × client × content |
fact_content_query_90d | 2,414,248 | Client × content × query hash |
Exclusions
We filtered to content items with: (1) impressions over 90 days > 0, (2) content age ≥ 90 days, and (3) prior-window impressions > 0 (needed for label computation). This yielded 144,575 items across 53 clients with a declining rate of 25.8%.
What We Excluded (and Why)
Label-derived fields (trend_direction, trend_pct) — these encode the outcome and would create leakage. Pseudonymous IDs (content_id, client_id) — used for grouping and splits only, never as features. Product-decision fields (health_score, priority_score, action_type, refresh_tier) — these encode the decision the model is intended to support.
3. Methodology
Label Definition
is_declining = 1 if impressions_last_30d < 0.8 × impressions_prev_30d — a ≥20% month-over-month drop. This captures meaningful traffic loss while filtering out normal fluctuation.
Because this label is computed from observed performance windows, the output should be interpreted as a ranked diagnosis of current decline—not as the probability that an otherwise healthy page will decline next month.
Feature Groups (18 features)
| Group | Features | Signal |
|---|---|---|
| Visibility (3) | log_impressions_90d, days_with_impressions, impression_tier | How visible is this page? |
| Position (2) | avg_position, position_tier | Where does it rank? |
| Freshness (3) | content_age_days, days_since_last_update, freshness_tier | How old is the content? |
| Content Depth (1) | visible_queries | How deep is the content? |
| Engagement (6) | ctr, engagement_rate, scroll_rate, ai_traffic_pct, log_clicks_90d, log_sessions_90d | How do users interact? |
| Demand/Keyword (3) | rare_share, anon_share, top_query_share | What's the keyword landscape? |
Baseline
A transparent 4-component rule: Visibility (40%), Freshness Risk (30%), Position Opportunity (25%), Depth Gap (5%). Each component is a percentile-rank score. This is a fair comparison because it uses the same features and data — it just can't capture non-linear interactions.
Validation Design
Client-grouped 80/20 split — entire clients held out for testing (42 train, 11 test). The model must generalize to unseen clients, not memorize client-specific patterns. A stratified random split is also tested to measure memorization risk.
Leakage Checks
We verified no product-decision fields or future-looking fields appear in the scoring inputs. Label-derived columns (trend_direction, trend_pct) are excluded from features. The query table's 90-day window overlaps with the label window — only *_prev30-style columns are used as features.
4. Results
Experiment 1: Which Signals Matter?
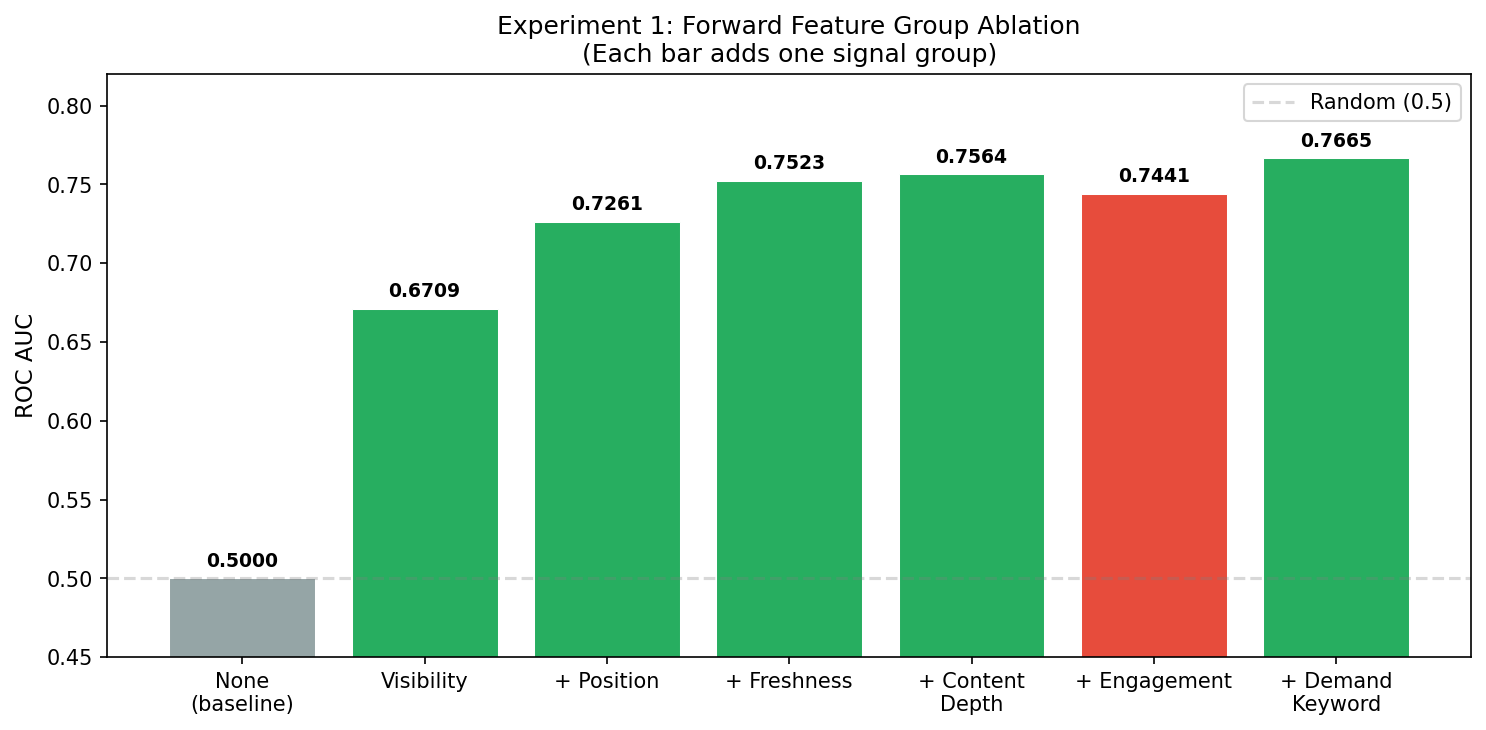
The forward feature group ablation reveals a clear hierarchy. Visibility is the dominant signal, contributing +0.17 ROC AUC on its own — more than half of the total model lift. Position and freshness add meaningful incremental value. Engagement metrics are surprisingly noisy.
| Run | Groups Added | Features | ROC AUC | Δ AUC | P@50 | P@100 |
|---|---|---|---|---|---|---|
| 0 | — (baseline) | 0 | 0.5000 | — | 0.622 | 0.622 |
| 1 | + Visibility | 3 | 0.6709 | +0.171 | 0.920 | 0.890 |
| 2 | + Position | 5 | 0.7261 | +0.055 | 0.980 | 0.930 |
| 3 | + Freshness | 8 | 0.7523 | +0.026 | 0.920 | 0.930 |
| 4 | + Content Depth | 9 | 0.7564 | +0.004 | 0.960 | 0.950 |
| 5 | + Engagement | 15 | 0.7441 | −0.012 | 0.960 | 0.950 |
| 6 | + Demand/Keyword | 18 | 0.7665 | +0.022 | 1.000 | 0.970 |
Experiment 2: Is the Random Forest Necessary?
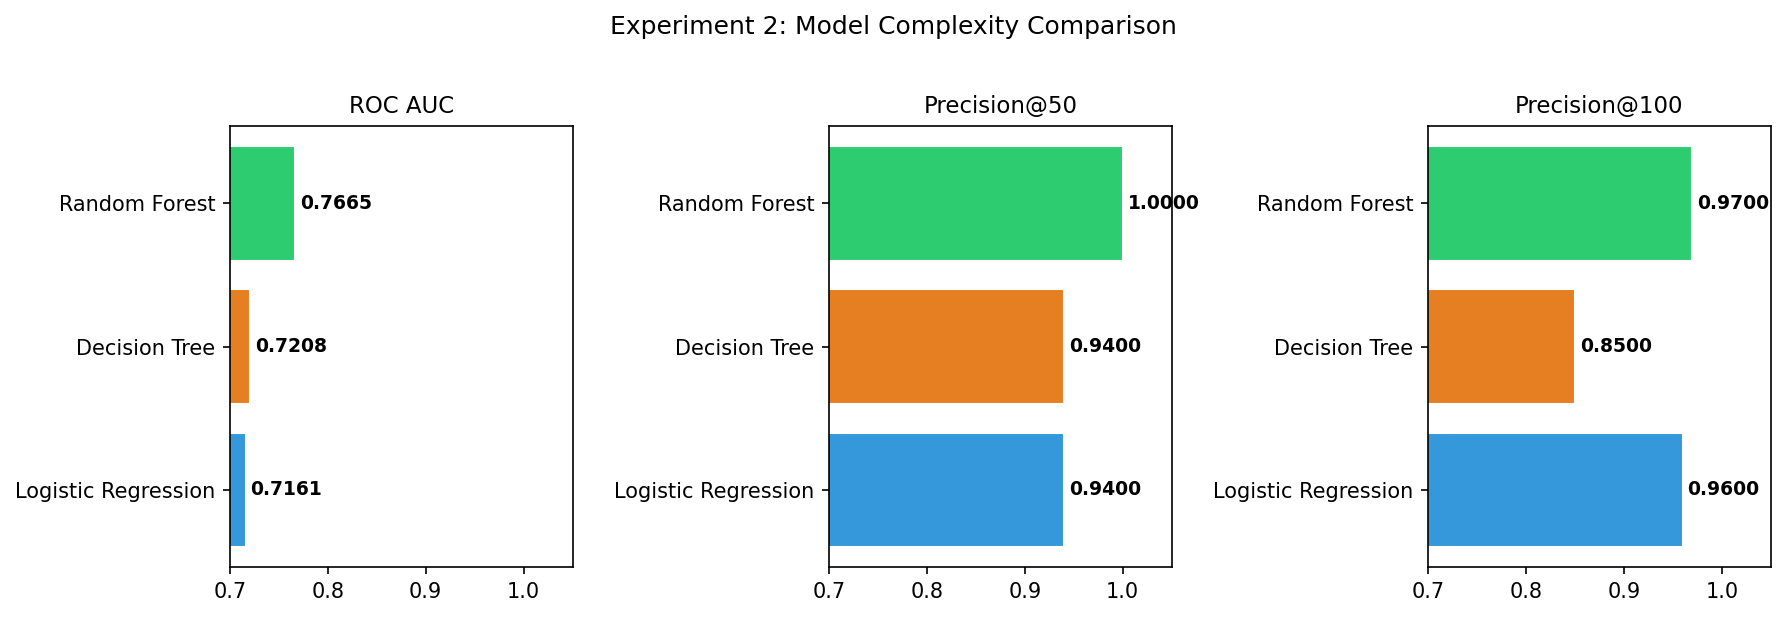
Yes. The Random Forest outperforms Logistic Regression by +0.05 AUC, indicating that non-linear feature interactions carry meaningful signal for decline detection.
| Model | ROC AUC | Precision@50 | Precision@100 |
|---|---|---|---|
| Logistic Regression | 0.7161 | 0.94 | 0.96 |
| Decision Tree | 0.7208 | 0.94 | 0.85 |
| Random Forest | 0.7665 | 1.00 | 0.97 |
Experiment 3: Does the Model Generalize?
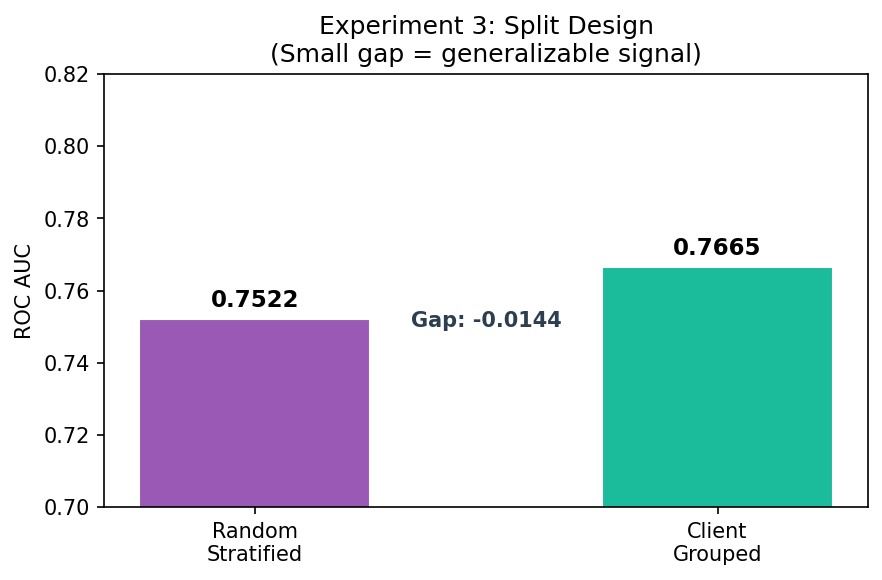
The client-grouped split reaches AUC 0.767, compared with 0.752 for the random split. The random split provides no apparent performance advantage, which reduces—but does not eliminate—the concern that the result depends on memorizing client-specific patterns.
Experiment 4: Is the Finding Robust?
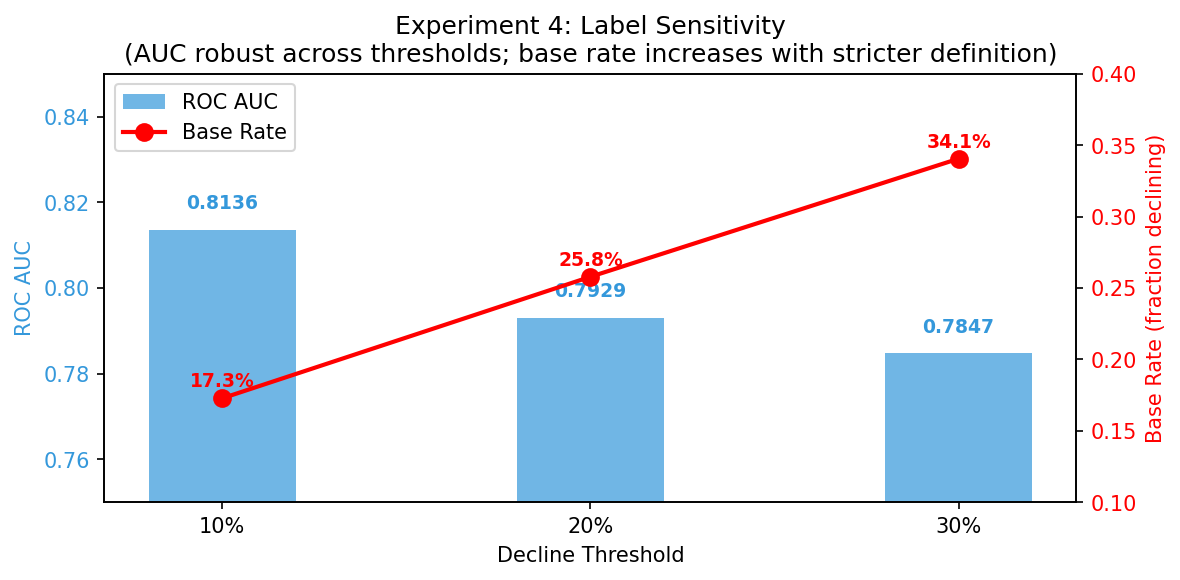
In the threshold-sensitivity runs, ROC AUC ranges from 0.785 to 0.814 across decline definitions of 10%, 20%, and 30%—a spread of 0.029. Each threshold creates a different label cohort, so these values should be read as a robustness check rather than substituted directly for the headline evaluation.
Feature Importance
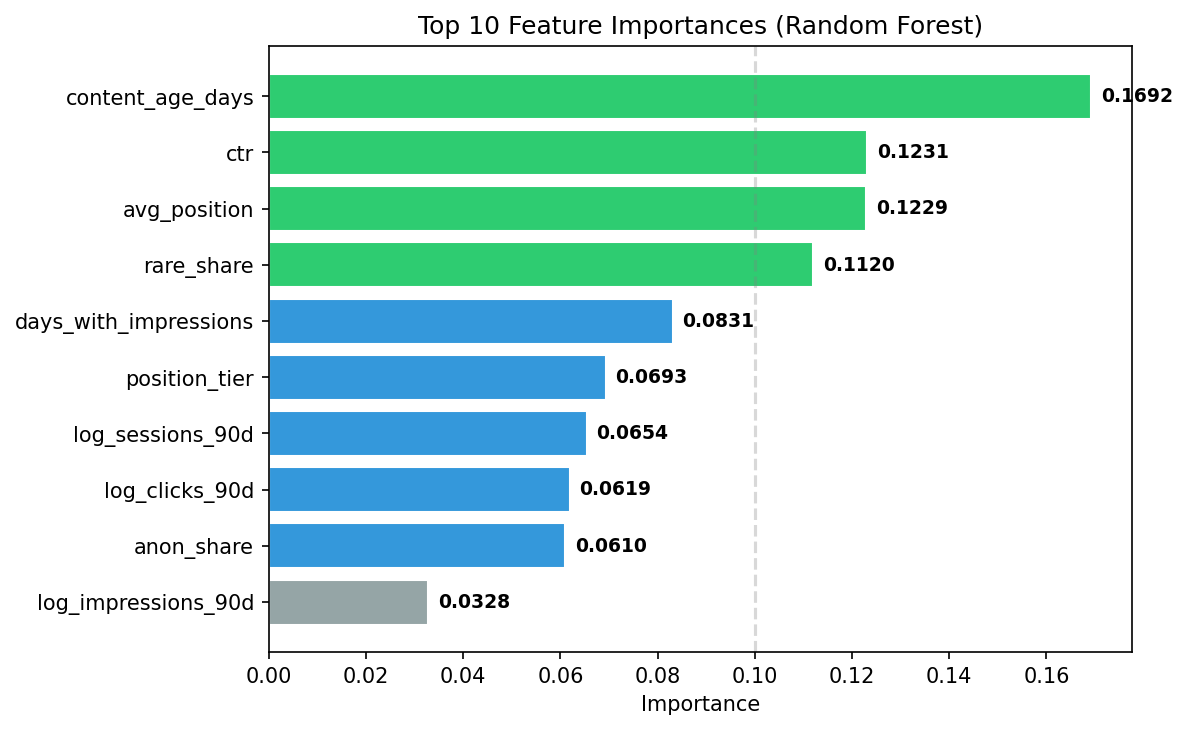
Model-based feature importance ranks content age, CTR, and average position highest, with keyword diversity (rare_share) fourth. Importance describes how much the fitted model uses a feature; it does not establish the direction of the relationship or a causal effect.
Headline Result
On the held-out client-grouped evaluation, the Random Forest achieves ROC AUC 0.767 with 100% precision among the top 50 ranked items. Visibility alone accounts for 68% of the measured lift over the 0.50 AUC reference.
5. Limitations
Detection, not forecasting. The label describes a decline already visible between two historical windows. A prospective forecasting system would need a strict cutoff where every feature predates the future outcome.
No causal claims. This model identifies association between features and decline, not causation. Refreshing a page may not cause impression recovery — confounders (seasonality, competitor actions, algorithm changes) are uncontrolled.
Client scope. The model was trained on 53 clients in the warehouse. Its performance on new clients or verticals outside this dataset is untested.
Temporal stability. The data covers Jan 2025 – Jun 2026. Search engine algorithm changes during or after this window could shift the relationships the model learned.
Engagement noise. Engagement features hurt model performance. This may reflect measurement noise — the data dictionary notes that scroll_rate and ai_traffic_pct can exceed 100 due to mismatched numerators/denominators.
Base rate sensitivity. The declining rate varies from 17.3% (10% threshold) to 34.1% (30% threshold). Precision metrics are influenced by base rates — always compare against the base rate.
Decision-support, not decision. This system recommends what to look at, not what to do. The editorial decision to refresh, monitor, or leave alone requires human judgment about content quality, business priority, and competitive context.
The defensible claim is narrow: the model ranks observed decline cases for review. It does not identify causes, guarantee recovery, or replace editorial judgment.
6. Ranked Recommendations
The action playbook for a FlyRank editorial team, ordered by expected impact:
Refresh stale, visible content
Signal: content_age_days is the #1 feature. Pages older than 180 days with impressions > 500 are the highest-priority refresh targets.
Action: Audit content accuracy, update statistics, refresh headings and internal links.
Fix low-CTR pages in visible positions
Signal: ctr is the model's #2 feature by importance. Pages ranking positions 1–10 with CTR < 0.5% are candidates for closer review.
Action: Rewrite meta titles and descriptions. Consider content format changes (add tables, FAQ schema).
Review long-tail keyword pages
Signal: rare_share is #4. Pages relying on many rare, low-volume queries are harder to maintain.
Action: Consolidate thin long-tail pages. Merge overlapping content. Target higher-volume keywords.
Monitor position-decay pages
Signal: avg_position is #3. Pages ranking positions 5–15 are on the "position decay" boundary.
Action: Track weekly. If position drops below 10, escalate to Priority 1.
What NOT to prioritize
Engagement metrics (scroll rate, engagement rate) are noisy signals. The ablation study showed they hurt model performance. Do not use engagement alone to drive refresh decisions — pair it with visibility and freshness signals.
7. Reproducibility
Environment: Python 3.12+, scikit-learn, pandas, numpy, matplotlib, duckdb, huggingface_hub.
Random seed: 42 (all experiments).
Notebooks
How to Rerun
- Clone the repo
pip install -r requirements.txt- Run
abalation_kaggle.ipynb(requires HuggingFace READ token) - Results written to
work/outputs/ablation_results.json - Charts written to
work/outputs/charts/
8. Acknowledgments & Data Credit
Built on the FlyRank ML Internship dataset. This research uses data from the FlyRank internship warehouse — a real-world SEO analytics dataset containing pseudonymized content performance metrics across 104 clients and 519K+ content items.
Standard research practice requires crediting data sources. The FlyRank dataset provides a rare opportunity to study content decline detection on real search performance data at scale.